 Voxer Engineering
Introducing Zag
Posted by DJ Gardiner on 03 Mar 2014The development and administration of complex systems is always a challenge. Keeping these systems running optimally can require monitoring thousands of metrics. This task is complicated when enhancements or fixes are applied. While log files are an essential tool for analyzing systems, they have their limitations. More flexible and efficient methods are required as the scale increases.
Voxer built Zag for this very purpose, and it has become an indispensable tool to help develop and maintain the Voxer system by collecting, aggregating, and visualizing metrics.
Zag includes many features including:
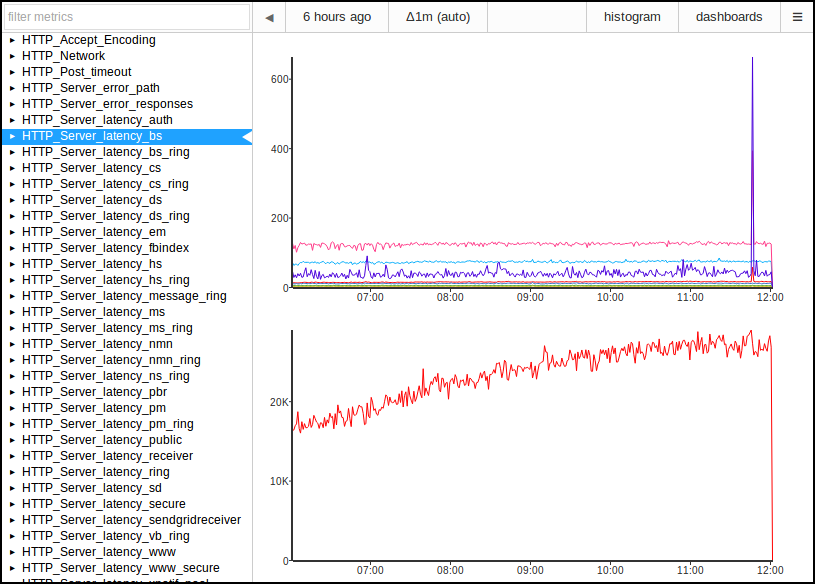
- Dynamical zooming and panning of graphs
- Analyze historical or live data
- Dashboards
- Tags
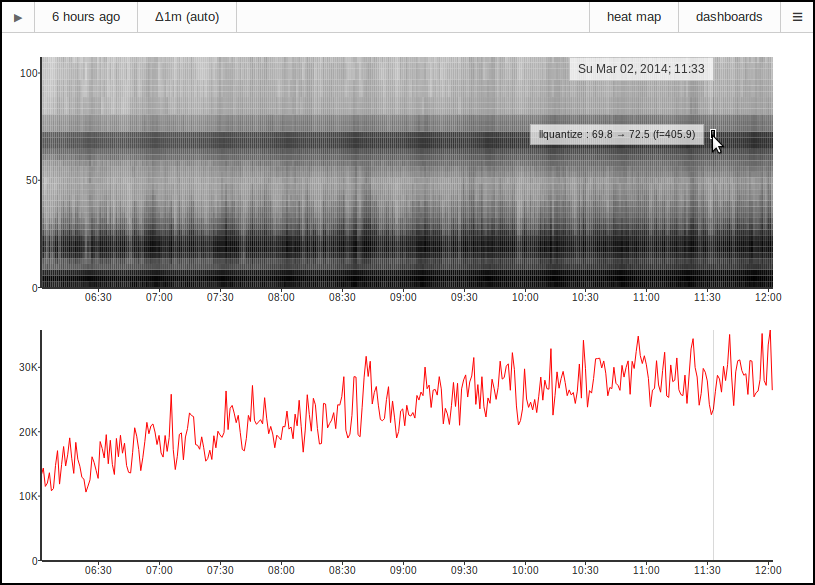
- Histograms, counters, and heat maps
Check out the project documentation, the source on GitHub, or skip to the installation instructions.
Recording a metric is as simple as agent.histogram("sample-histogram", 123) or
agent.counter("sample-counter", 123).